Data Wrangling in R with the Tidyverse (Part 2)
Jessica Minnier, PhD & Meike Niederhausen, PhD
OCTRI Biostatistics, Epidemiology, Research & Design (BERD) Workshop
2019/04/18 (Part 1) & 2019/04/25 (Part 2)
and again! 2019/05/16 (Part 1) & 2019/05/23 (Part 2)
slides: bit.ly/berd_tidy2
pdf: bit.ly/berd_tidy2_pdf
Load files for today's workshop
- Open the slides of this workshop: bit.ly/berd_tidy2
- If you haven't already,
- Open the pre-workshop homework
- Follow steps 1-5
- Download zip folder
- Open
berd_tidyverse_project.Rproj
- Open a new R script and run the commands to the right
# install.packages("tidyverse","janitor","glue") library(tidyverse)library(lubridate) library(janitor)library(glue)demo_data <- read_csv("data/yrbss_demo.csv")qn_data <- read_csv("data/yrbss_qn.csv")
Learning objectives
Previously, in Part 1:
- What is data wrangling?
- A few good practices in R/RStudio
- What is tidy data?
- What is tidyverse?
- Manipulate data
Part 2:
- Summarizing data
- Combine (join) data sets
- Reshaping data: wide vs. long formats
- Data cleaning:
- Missing data
- Strings/character vectors
- Dates
- Factors
- Messy names
Review Part 1: manipulating data
Columns (part 1 slides)
select()to subset columnsrename()to rename columnsmutate()to add new columns or change values within existing columnsseparate()andunite()are shortcuts for specificmutatetype operations
Rows (part 1 slides)
filter()to subset rowsna.omit()anddistinct()are shortcuts for specificfiltertype operations
arrange()to order the data
Changing all columns at once (part 1 slides)
mutate_all(), rename_all(): applies a function to all columns: mutate_all(FUNCTION, FUNCTION_ARGUMENTS)
# mutate_all changes the data in all columnsdemo_data %>% mutate_all(as.character) %>% head(2)# A tibble: 2 x 8 record age sex grade race4 race7 bmi stweight <chr> <chr> <chr> <chr> <chr> <chr> <chr> <chr> 1 931897 15 years old Female 10th White White 17.179 54.43 2 333862 17 years old Female 12th White White 20.2487 57.15# rename_all changes all column namesdemo_data %>% rename_all(str_sub, end = 2) %>% head(3)# A tibble: 3 x 8 re ag se gr ra ra bm st <dbl> <chr> <chr> <chr> <chr> <chr> <dbl> <dbl>1 931897 15 years old Female 10th White White 17.2 54.42 333862 17 years old Female 12th White White 20.2 57.23 36253 18 years old or… Male 11th Hispanic/La… Hispanic/L… NA NAChanging some columns at once (part 1 slides)
mutate_at(), rename_at(): uses vars() to select specific variables to apply a function to i.e. mutate_at(vars(SELECT), FUNCTION, FUNCTION_ARGUMENTS)
# mutate_at changes the data in specified columnsdemo_data %>% mutate_at(vars(contains("race"), sex), as.factor) %>% head(2)# A tibble: 2 x 8 record age sex grade race4 race7 bmi stweight <dbl> <chr> <fct> <chr> <fct> <fct> <dbl> <dbl>1 931897 15 years old Female 10th White White 17.2 54.42 333862 17 years old Female 12th White White 20.2 57.2# rename_at changes specified column namesdemo_data %>% rename_at(vars(record:grade),toupper) %>% head(3)# A tibble: 3 x 8 RECORD AGE SEX GRADE race4 race7 bmi stweight <dbl> <chr> <chr> <chr> <chr> <chr> <dbl> <dbl>1 931897 15 years old Female 10th White White 17.2 54.42 333862 17 years old Female 12th White White 20.2 57.23 36253 18 years old o… Male 11th Hispanic/L… Hispanic/… NA NAChanging some columns at once (part 1 slides)
mutate_if(), rename_if(), select_if(): uses a function that returns TRUE/FALSE to select columns and applies function on the TRUE columns:mutate_if(BOOLEAN, FUNCTION, FUNCTION_ARGUMENTS)
demo_data %>% mutate_if(is.numeric, round, digits = 0) %>% head(3)# A tibble: 3 x 8 record age sex grade race4 race7 bmi stweight <dbl> <chr> <chr> <chr> <chr> <chr> <dbl> <dbl>1 931897 15 years old Female 10th White White 17 542 333862 17 years old Female 12th White White 20 573 36253 18 years old o… Male 11th Hispanic/L… Hispanic/… NA NAdemo_data %>% rename_if(is.character, str_sub, end = 2) %>% head(3)# A tibble: 3 x 8 record ag se gr ra ra bmi stweight <dbl> <chr> <chr> <chr> <chr> <chr> <dbl> <dbl>1 931897 15 years old Female 10th White White 17.2 54.42 333862 17 years old Female 12th White White 20.2 57.23 36253 18 years old o… Male 11th Hispanic/L… Hispanic/… NA NAAdd one or more rows: add_row()
demo_data %>% add_row(record=100, age=NA, sex="Female", grade="9th") %>% arrange(record) %>% head(3)# A tibble: 3 x 8 record age sex grade race4 race7 bmi stweight <dbl> <chr> <chr> <chr> <chr> <chr> <dbl> <dbl>1 100 <NA> Female 9th <NA> <NA> NA NA2 30592 <NA> <NA> <NA> <NA> <NA> NA NA3 30593 <NA> <NA> 9th Hispanic/Latino Hispanic/Latino NA NAdemo_data %>% add_row(record=100:102, bmi=c(25,30,18)) %>% arrange(record) %>% head(3)# A tibble: 3 x 8 record age sex grade race4 race7 bmi stweight <dbl> <chr> <chr> <chr> <chr> <chr> <dbl> <dbl>1 100 <NA> <NA> <NA> <NA> <NA> 25 NA2 101 <NA> <NA> <NA> <NA> <NA> 30 NA3 102 <NA> <NA> <NA> <NA> <NA> 18 NAAdd one or more columns: add_column()
demo_data %>% add_column(study_date = "2019-04-10", .after="record") %>% head(3)# A tibble: 3 x 9 record study_date age sex grade race4 race7 bmi stweight <dbl> <chr> <chr> <chr> <chr> <chr> <chr> <dbl> <dbl>1 931897 2019-04-10 15 years … Female 10th White White 17.2 54.42 333862 2019-04-10 17 years … Female 12th White White 20.2 57.23 36253 2019-04-10 18 years … Male 11th Hispani… Hispan… NA NAdemo_data %>% add_column(id = 1:nrow(demo_data), .before="record") %>% head(3)# A tibble: 3 x 9 id record age sex grade race4 race7 bmi stweight <int> <dbl> <chr> <chr> <chr> <chr> <chr> <dbl> <dbl>1 1 931897 15 years old Female 10th White White 17.2 54.42 2 333862 17 years old Female 12th White White 20.2 57.23 3 36253 18 years ol… Male 11th Hispanic… Hispanic… NA NAFrequency tables: janitor package's tabyl function
# default tabledemo_data %>% tabyl(grade) grade n percent valid_percent 10th 4907 0.24535 0.2504338 11th 4891 0.24455 0.2496172 12th 4577 0.22885 0.2335919 9th 5219 0.26095 0.2663570 <NA> 406 0.02030 NA# output can be treated as tibbledemo_data %>% tabyl(grade) %>% select(-n) grade percent valid_percent 10th 0.24535 0.2504338 11th 0.24455 0.2496172 12th 0.22885 0.2335919 9th 0.26095 0.2663570 <NA> 0.02030 NAadorn_ your table!
demo_data %>% tabyl(grade) %>% adorn_totals("row") %>% adorn_pct_formatting(digits=2) grade n percent valid_percent 10th 4907 24.54% 25.04% 11th 4891 24.45% 24.96% 12th 4577 22.88% 23.36% 9th 5219 26.10% 26.64% <NA> 406 2.03% - Total 20000 100.00% 100.00%2x2 tabyls
# default 2x2 tabledemo_data %>% tabyl(grade, sex) grade Female Male NA_ 10th 2332 2539 36 11th 2365 2496 30 12th 2277 2263 37 9th 2492 2684 43 <NA> 126 195 85What adornments does the tabyl to right have?
demo_data %>% tabyl(grade, sex) %>% adorn_percentages(denominator = "col") %>% adorn_totals("row") %>% adorn_pct_formatting(digits = 1) %>% adorn_ns() grade Female Male NA_ 10th 24.3% (2332) 24.9% (2539) 15.6% (36) 11th 24.7% (2365) 24.5% (2496) 13.0% (30) 12th 23.7% (2277) 22.2% (2263) 16.0% (37) 9th 26.0% (2492) 26.4% (2684) 18.6% (43) <NA> 1.3% (126) 1.9% (195) 36.8% (85) Total 100.0% (9592) 100.0% (10177) 100.0% (231)- Notice
gradeis not sorted in a pleasing way. We will learn how to deal with this when we discussfactorsas a data type in R. - Base R has a
tablefunction, but it is clunkier and the output is not a data frame. - See the tabyl vignette for more information, adorn options, & 3-way
tabyls
Numerical data summaries: summarize()
- We can summarize data as a whole, or in groups with
group_by() group_by()is very powerful, see data wrangling cheatsheet- Can also use
summarize_at(),summarize_if(),summarize_all()
# summary of all data as a wholedemo_data %>% summarize(bmi_mean =mean(bmi,na.rm=TRUE), bmi_sd = sd(bmi,na.rm=TRUE))# A tibble: 1 x 2 bmi_mean bmi_sd <dbl> <dbl>1 23.5 4.99What does na.rm=TRUE do and what happens if we leave it out?
# summary by group variabledemo_data %>% group_by(grade) %>% summarize(n_per_group = n(), bmi_mean =mean(bmi,na.rm=TRUE), bmi_sd = sd(bmi,na.rm=TRUE))# A tibble: 5 x 4 grade n_per_group bmi_mean bmi_sd <chr> <int> <dbl> <dbl>1 <NA> 406 23.5 6.452 10th 4907 23.2 4.763 11th 4891 23.8 4.894 12th 4577 24.2 5.205 9th 5219 22.8 4.92Rows (cases): paste data below each other
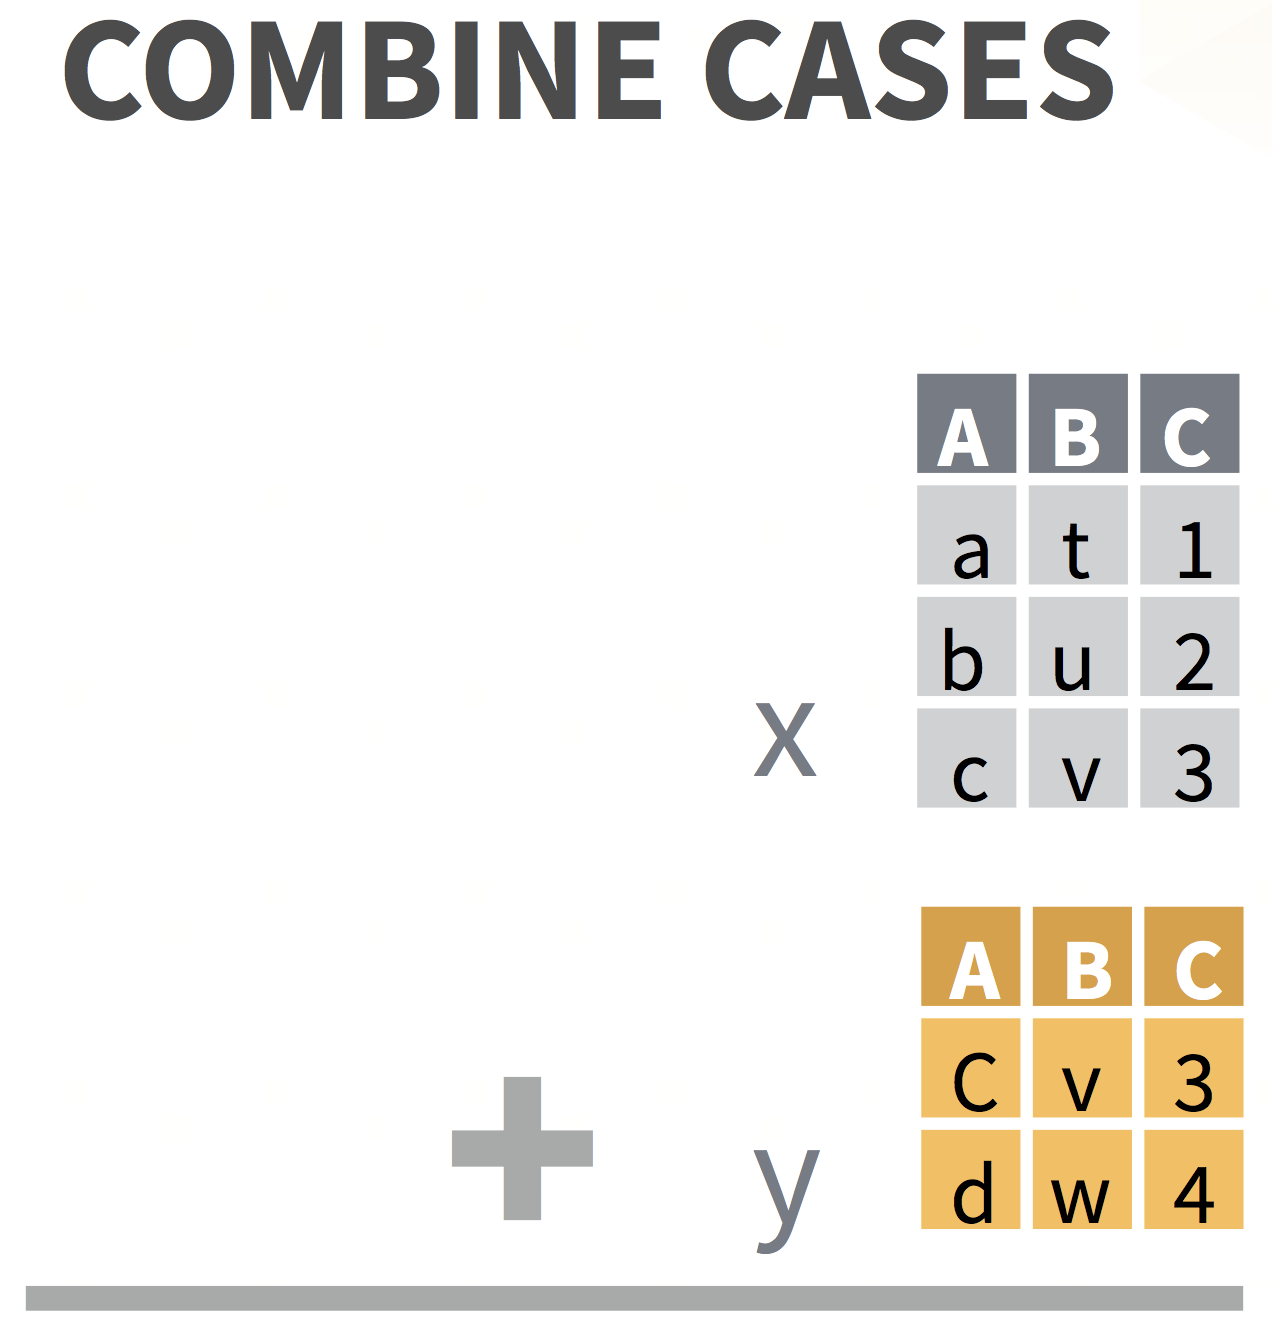
bind_rows() combines rows from different data sets
& accounts for different column names
data1# A tibble: 2 x 4 id name height age <int> <chr> <dbl> <dbl>1 1 Nina 2 42 2 Yi 1 2data2# A tibble: 3 x 4 id name height years <int> <chr> <dbl> <dbl>1 7 Bo 2 32 8 Al 1.7 13 9 Juan 1.8 2bind_rows(data1,data2, .id = "group")# A tibble: 5 x 6 group id name height age years <chr> <int> <chr> <dbl> <dbl> <dbl>1 1 1 Nina 2 4 NA2 1 2 Yi 1 2 NA3 2 7 Bo 2 NA 34 2 8 Al 1.7 NA 15 2 9 Juan 1.8 NA 2
dplyr data transformation cheatsheet
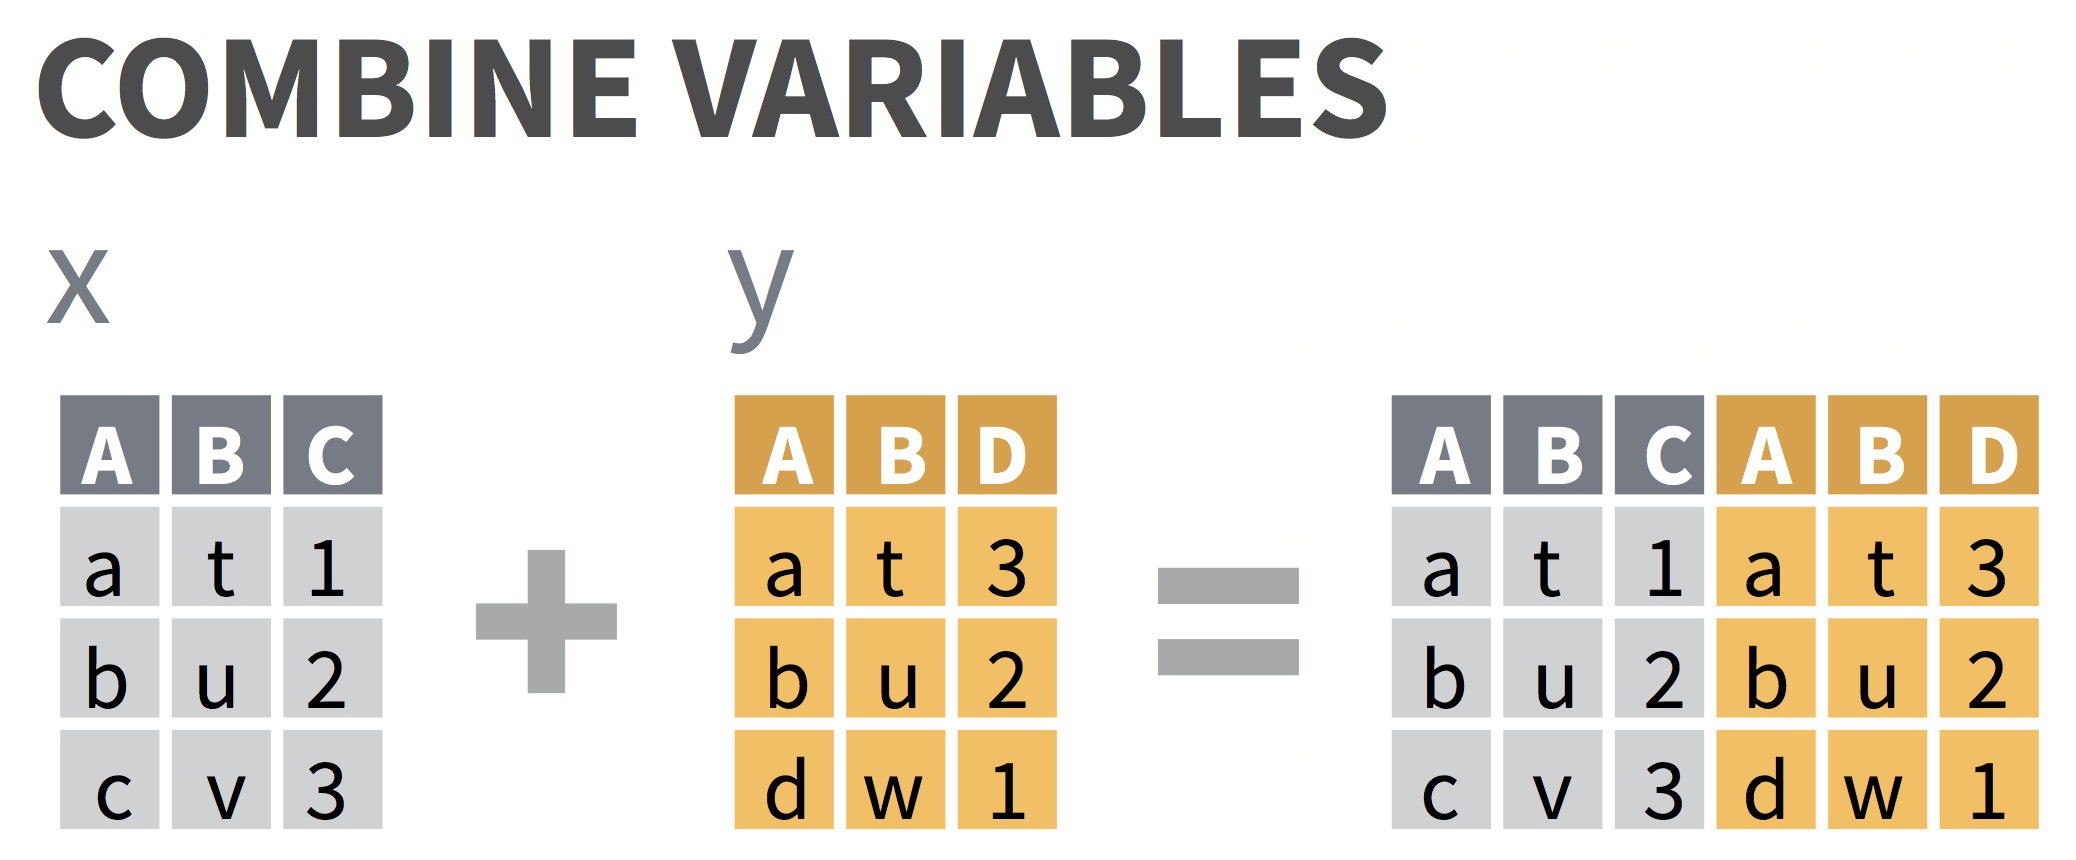
Columns (variables): DO NOT USE bind_cols()!!
bind_cols()blindly pastes columns next to each other without preserving order of variables that they have in common- Use
jointo preserve ordering - see next slides
- Use
# datasets must have same number of rows to use bind_cols()demo_sub <- demo_data %>% slice(1:20) # first 20 rows of demo_dataqn_sub <- qn_data %>% slice(1:20) # first 20 rows of qn_databind_cols(demo_sub, qn_sub) # blindly bind columns; 2nd record column got renamed# A tibble: 20 x 13 record age sex grade race4 race7 bmi stweight record1 q8 q12 <dbl> <chr> <chr> <chr> <chr> <chr> <dbl> <dbl> <dbl> <chr> <chr> 1 9.32e5 15 y… Fema… 10th White White 17.2 54.4 922375 Neve… <NA> 2 3.34e5 17 y… Fema… 12th White White 20.2 57.2 36718 Neve… <NA> 3 3.63e4 18 y… Male 11th Hisp… Hisp… NA NA 187667 Did … <NA> 4 1.10e6 15 y… Male 10th Blac… Blac… 28.0 85.7 109951 Did … <NA> 5 1.30e6 14 y… Male 9th All … Mult… 24.5 66.7 1109733 Neve… <NA> 6 2.62e5 17 y… Male 9th All … <NA> NA NA 761127 Most… <NA> 7 9.27e5 16 y… Male 11th All … Asian 20.5 70.3 930811 Neve… <NA> 8 1.31e6 17 y… Male 12th White White 19.3 59.0 401921 Rare… <NA> 9 5.06e5 18 y… Male 12th Hisp… Hisp… 33.1 123. 42244 Rare… <NA> 10 1.80e5 14 y… Male 10th Blac… Blac… NA NA 271375 Alwa… <NA> 11 1.10e6 15 y… Male 9th <NA> <NA> 17.1 45.4 639521 Rare… <NA> 12 1.31e6 16 y… Male 10th Hisp… Hisp… 21.8 66.7 1309762 Did … 6 to…13 3.12e4 15 y… Male 10th All … <NA> NA NA 1313278 Did … All …14 1.09e5 16 y… Male 11th White White NA NA 640176 Did … <NA> 15 1.81e5 15 y… Male 9th White White NA NA 925706 Did … <NA> 16 1.31e6 15 y… Fema… 10th White White 22.0 65.8 1306447 Neve… I di…17 7.70e5 16 y… Fema… 10th White White 32.4 86.2 31079 Neve… <NA> 18 9.38e5 18 y… Fema… 12th White White 21.7 64.9 185891 Some… <NA> 19 1.31e6 16 y… Male 11th White White 28.3 102. 270777 Alwa… <NA> 20 2.72e5 18 y… Fema… 11th White White NA NA 1313665 Neve… 0 da…# … with 2 more variables: q31 <chr>, qn24 <lgl>joining your data sets
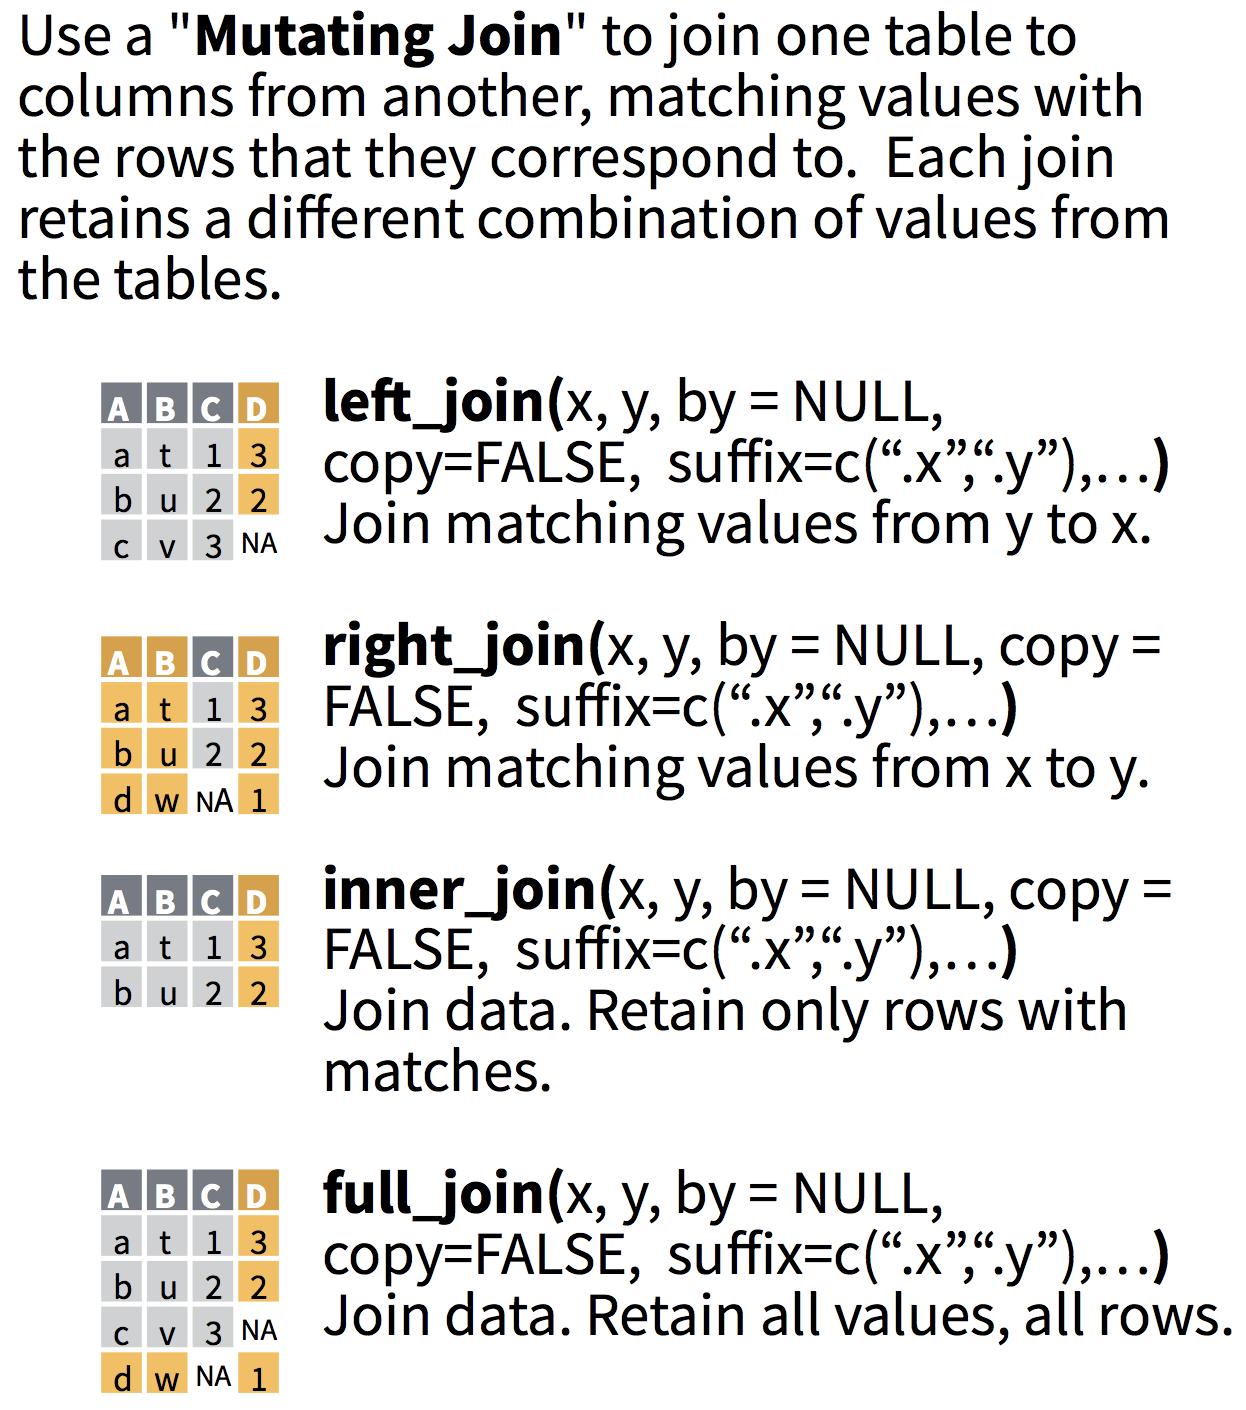
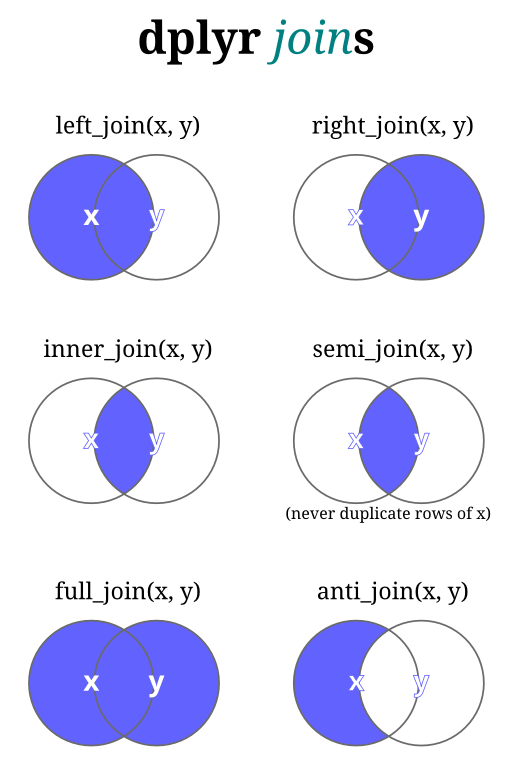
Joinuses overlapping or selected columns to combine two or more data sets.- Also called "merging" or "mutating join".
- Function names are based off of SQL operations for databases.
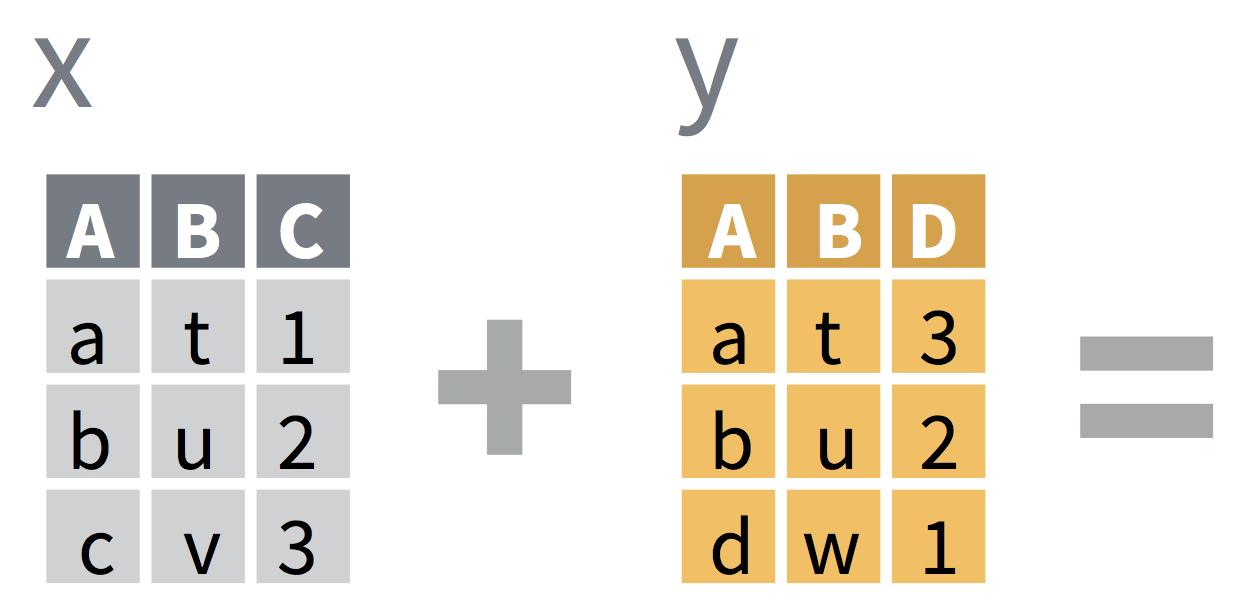
Most commonly used: left_join()
left_join(x,y)includes all observations inx, regardless of whether they match ones inyor not.- It includes all columns in
y, but only rows that matchx's observations.
df1 <- tibble(a = c(1, 2), b = 2:1)df2 <- tibble(a = c(1, 3), c = 10:11)df1df2# A tibble: 2 x 2 a b <dbl> <int>1 1 22 2 1# A tibble: 2 x 2 a c <dbl> <int>1 1 102 3 11left_join(df1, df2)# A tibble: 2 x 3 a b c <dbl> <int> <int>1 1 2 102 2 1 NA- Which common column(s) were used to merge the datasets?
- What if we want to specify which columns to join by when merging?
see next slide...
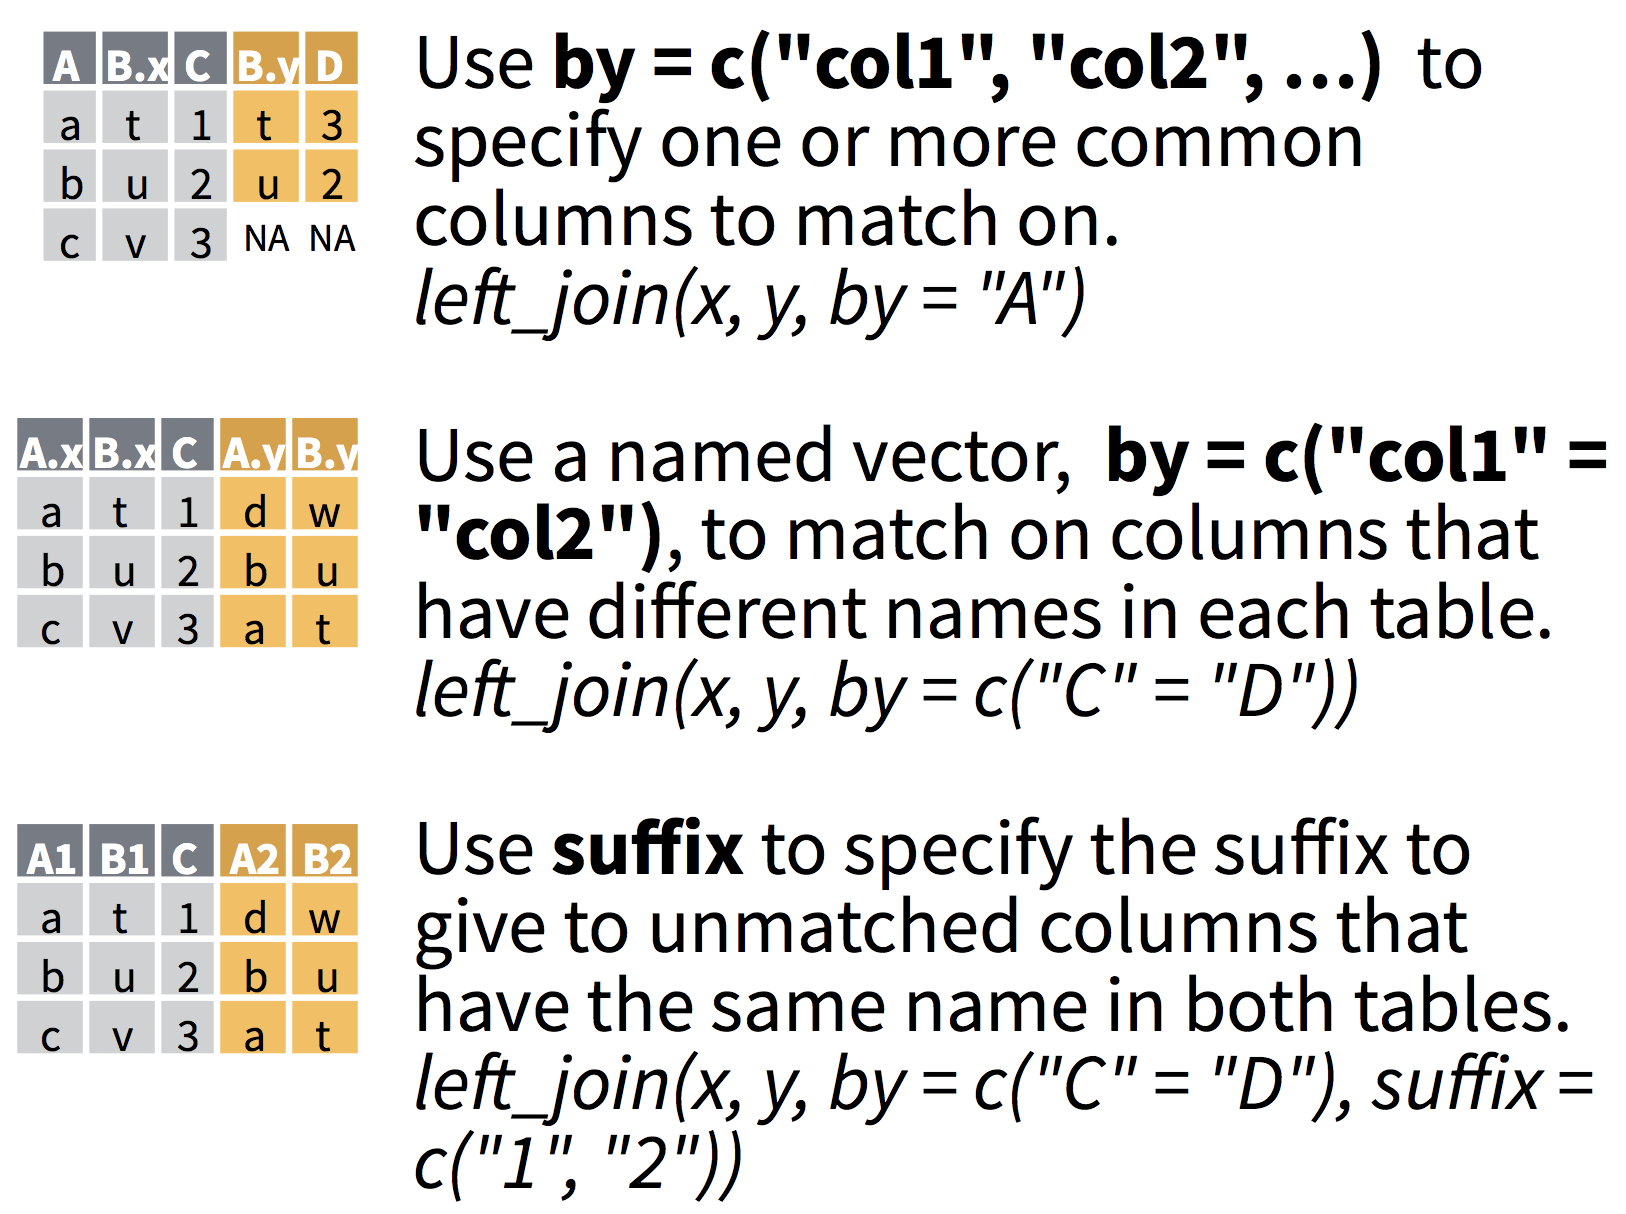
Which columns will be used to join?
- If no columns are specified to join by, then all overlapping (intersecting) column names will be used
- Often we want to specify which columns to use,
- and also how to rename duplicated columns that were not merged

Check for overlapping column names
Goal: merge the demographics (demo_data) and questionnaire (qn_data) together.
What column names do these datasets have in common?
colnames(demo_data)[1] "record" "age" "sex" "grade" "race4" "race7" [7] "bmi" "stweight"colnames(qn_data)[1] "record" "q8" "q12" "q31" "qn24"intersect(colnames(demo_data), colnames(qn_data))[1] "record"Merge demo_data and qn_data together
Let's do a full join so that we keep all data from both datasets
merged_data <- full_join(demo_data, qn_data, by = "record")# Check dimensions of original and new datasetsdim(demo_data); dim(qn_data); dim(merged_data)[1] 20000 8[1] 10000 5[1] 20000 12merged_data# A tibble: 20,000 x 12 record age sex grade race4 race7 bmi stweight q8 q12 q31 <dbl> <chr> <chr> <chr> <chr> <chr> <dbl> <dbl> <chr> <chr> <chr> 1 9.32e5 15 y… Fema… 10th White White 17.2 54.4 Neve… <NA> Yes 2 3.34e5 17 y… Fema… 12th White White 20.2 57.2 <NA> <NA> <NA> 3 3.63e4 18 y… Male 11th Hisp… Hisp… NA NA Neve… <NA> <NA> 4 1.10e6 15 y… Male 10th Blac… Blac… 28.0 85.7 Neve… <NA> Yes 5 1.30e6 14 y… Male 9th All … Mult… 24.5 66.7 <NA> <NA> <NA> 6 2.62e5 17 y… Male 9th All … <NA> NA NA <NA> <NA> <NA> 7 9.27e5 16 y… Male 11th All … Asian 20.5 70.3 <NA> <NA> <NA> 8 1.31e6 17 y… Male 12th White White 19.3 59.0 Neve… 3 to… No 9 5.06e5 18 y… Male 12th Hisp… Hisp… 33.1 123. <NA> <NA> <NA> 10 1.80e5 14 y… Male 10th Blac… Blac… NA NA Neve… <NA> No # … with 19,990 more rows, and 1 more variable: qn24 <lgl>Learn more about joining data
- Two-table verbs vignette for
dplyrpackage - Jenny Bryan's STAT545 dplyr cheatsheet for join
- R for Data Science's "Relational data" chapter (great diagrams)
Practice
Add a column of
1's toqn_datacalledqn_yesand save the resulting data asqn_data2.Join
demo_dataandqn_data2by columnrecord. Keep all rows fromdemo_dataand only rows fromqn_data2that match records indemo_data. Call the resulting dataall_data.Create a
tabyl()ofqn_yesfor the dataall_data.Create a 2x2 table of
qn_yesvsgrade.
Note about the data:
- q8 = How often wear bicycle helmet
- q12 = Texted while driving
- q31 = Ever smoked
- qn24 = Bullied past 12 months
Wide vs. long data
- Wide data has one row per subject, with multiple columns for their repeated measurements
- Long data has multiple rows per subject, with one column for the measurement variable and another indicating from when/where the repeated measures are from
wide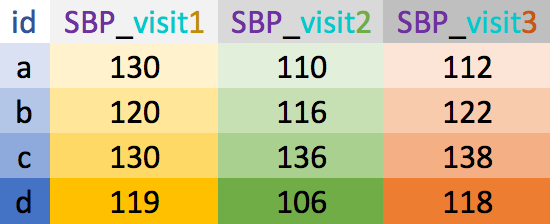
long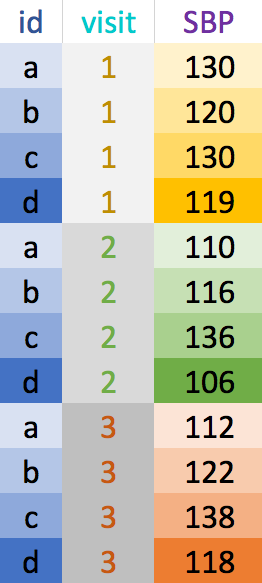
Example wide dataset
Copy and paste the code below into R to create this example dataset
BP_wide <- tibble(id = letters[1:4], sex = c("F", "M", "M", "F"), SBP_v1 = c(130, 120, 130, 119), SBP_v2 = c(110, 116, 136, 106), SBP_v3 = c(112, 122, 138, 118))BP_wide# A tibble: 4 x 5 id sex SBP_v1 SBP_v2 SBP_v3 <chr> <chr> <dbl> <dbl> <dbl>1 a F 130 110 1122 b M 120 116 1223 c M 130 136 1384 d F 119 106 118- What do you think the data in the table are measures of?
- How can we tell the data are wide?
Wide to long: gather()
BP_wide# A tibble: 4 x 5 id sex SBP_v1 SBP_v2 SBP_v3 <chr> <chr> <dbl> <dbl> <dbl>1 a F 130 110 1122 b M 120 116 1223 c M 130 136 1384 d F 119 106 118gather columns into rows to make the data long. Need to specify:
- new column names
- key: stores row names of wide data's gathered columns
- value: stores data values
- which columns to gather
BP_long <- BP_wide %>% gather(key = "visit", value = "SBP", SBP_v1:SBP_v3)BP_long# A tibble: 12 x 4 id sex visit SBP <chr> <chr> <chr> <dbl> 1 a F SBP_v1 130 2 b M SBP_v1 120 3 c M SBP_v1 130 4 d F SBP_v1 119 5 a F SBP_v2 110 6 b M SBP_v2 116 7 c M SBP_v2 136 8 d F SBP_v2 106 9 a F SBP_v3 11210 b M SBP_v3 12211 c M SBP_v3 13812 d F SBP_v3 118Long to wide: spread()
BP_long# A tibble: 12 x 4 id sex visit SBP <chr> <chr> <chr> <dbl> 1 a F SBP_v1 130 2 b M SBP_v1 120 3 c M SBP_v1 130 4 d F SBP_v1 119 5 a F SBP_v2 110 6 b M SBP_v2 116 7 c M SBP_v2 136 8 d F SBP_v2 106 9 a F SBP_v3 11210 b M SBP_v3 12211 c M SBP_v3 13812 d F SBP_v3 118spread rows into columns to make the data wide. Need to specify which columns in the long data to use:
- key column: has the variable names
- value column: has the data values
BP_wide2 <- BP_long %>% spread(key = "visit", value = "SBP")BP_wide2# A tibble: 4 x 5 id sex SBP_v1 SBP_v2 SBP_v3 <chr> <chr> <dbl> <dbl> <dbl>1 a F 130 110 1122 b M 120 116 1223 c M 130 136 1384 d F 119 106 118Clean up long data's visit column (key column)
BP_long# A tibble: 12 x 4 id sex visit SBP <chr> <chr> <chr> <dbl> 1 a F SBP_v1 130 2 b M SBP_v1 120 3 c M SBP_v1 130 4 d F SBP_v1 119 5 a F SBP_v2 110 6 b M SBP_v2 116 7 c M SBP_v2 136 8 d F SBP_v2 106 9 a F SBP_v3 11210 b M SBP_v3 12211 c M SBP_v3 13812 d F SBP_v3 118Goal: remove the string SBP_v from the visit variable's values.
BP_long2 <- BP_long %>% mutate(visit = str_replace(visit,"SBP_v","")) BP_long2# A tibble: 12 x 4 id sex visit SBP <chr> <chr> <chr> <dbl> 1 a F 1 130 2 b M 1 120 3 c M 1 130 4 d F 1 119 5 a F 2 110 6 b M 2 116 7 c M 2 136 8 d F 2 106 9 a F 3 11210 b M 3 12211 c M 3 13812 d F 3 118Make cleaned-up long data wide
head(BP_long2, 2)# A tibble: 2 x 4 id sex visit SBP <chr> <chr> <chr> <dbl>1 a F 1 1302 b M 1 120BP_wide3 <- BP_long2 %>% spread(key = "visit", value = "SBP")BP_wide3# A tibble: 4 x 5 id sex `1` `2` `3` <chr> <chr> <dbl> <dbl> <dbl>1 a F 130 110 1122 b M 120 116 1223 c M 130 136 1384 d F 119 106 118Problem: have numbers as column names, since spread's default is to use the levels of the key as the new row names.
Solution: have row names start with the key column's name separated by a character
BP_wide4 <- BP_long2 %>% spread(key = "visit", value = "SBP", sep="_") # specify separating characterBP_wide4# A tibble: 4 x 5 id sex visit_1 visit_2 visit_3 <chr> <chr> <dbl> <dbl> <dbl>1 a F 130 110 1122 b M 120 116 1223 c M 130 136 1384 d F 119 106 118Practice
Copy and paste the code below into R to create the dataset DBP_wide
DBP_wide <- tibble(id = letters[1:4], sex = c("F", "M", "M", "F"), v1.DBP = c(88, 84, 102, 70), v2.DBP = c(78, 78, 96, 76), v3.DBP = c(94, 82, 94, 74), age=c(23, 56, 41, 38) )- Make
DBP_wideinto a long dataframe based on the repeated DBP columns and save it asDBP_long. Clean up the visit column of
DBP_longso that the values are 1, 2, 3, and save it asDBP_long.Make
DBP_longwide with column namesvisit.1, visit.2, visit.3for the DBP values, and save it asDBP_wide2.Join
DBP_longwithBP_long2so that we have one data frame with columns id, sex, visit, SBP, DBP, and age. Save this asBP_both_long.
Data cleaning
(messy NAs, names, strings, dates, factors)




Removing missing data: drop_na()
A small data example:
mydata <- tibble(id = 7:9, name = c("Bo","Al","Juan"), height = c(2, NA, 1.8), years = c(51,35,NA))mydata# A tibble: 3 x 4 id name height years <int> <chr> <dbl> <dbl>1 7 Bo 2 512 8 Al NA 353 9 Juan 1.8 NARemove all rows with any missing data
mydata %>% drop_na()# A tibble: 1 x 4 id name height years <int> <chr> <dbl> <dbl>1 7 Bo 2 51Remove rows with NA in selected columns
mydata %>% drop_na(height)# A tibble: 2 x 4 id name height years <int> <chr> <dbl> <dbl>1 7 Bo 2 512 9 Juan 1.8 NAReplace NAs with another value: replace_na()
Use with mutate()
mydata# A tibble: 3 x 4 id name height years <int> <chr> <dbl> <dbl>1 7 Bo 2 512 8 Al NA 353 9 Juan 1.8 NAmydata %>% mutate(height = replace_na(height, "Unknown"), years = replace_na(years, 0) )# A tibble: 3 x 4 id name height years <int> <chr> <chr> <dbl>1 7 Bo 2 512 8 Al Unknown 353 9 Juan 1.8 0replace_na() advanced example
Replaces NAs in all columns starting with "q" with the string "No answer"
qn_data %>% mutate_at(vars(starts_with("q")), .funs = list(~replace_na(.,"No answer"))) %>% tabyl(q8, q31) q8 No No answer Yes Always wore a helmet 411 58 216 Did not ride a bicycle 1318 343 1223 Most of the time wore a helmet 320 31 173 Never wore a helmet 1429 418 1672 No answer 267 212 300 Rarely wore a helmet 481 73 405 Sometimes wore a helmet 351 53 246Convert (i.e. "No answer", 9999, etc) to NA: na_if()
all_data %>% tabyl(race4) race4 n percent valid_percent All other races 4713 0.23565 0.2443235 Black or African American 4093 0.20465 0.2121825 Hispanic/Latino 4670 0.23350 0.2420943 White 5814 0.29070 0.3013997 <NA> 710 0.03550 NAall_data %>% mutate(race4 = na_if(race4, "All other races")) %>% tabyl(race4) race4 n percent valid_percent Black or African American 4093 0.20465 0.2807848 Hispanic/Latino 4670 0.23350 0.3203677 White 5814 0.29070 0.3988475 <NA> 5423 0.27115 NAna_if() for all your data
Avoid this by reading in your data correctly:
smalldata <- read_csv("data/small_data.csv", na = c("","9999","NA")) # specify your own missing valuesOtherwise na_if() everything:
# replace all "" with NAall_data %>% mutate_if(is.character, .funs = na_if(.,""))# replace all 9999's with NA all_data %>% mutate_if(is.numeric, .funs = na_if(.,9999))Working with character strings
- Use the package
stringr(loaded withtidyverse) - Paste strings or values together with package
glue(installed, not loaded w/tidyverse) - advanced tip: learn "regular expressions" (regex) for pattern matching (see cheatsheet) and matching multiple characters/strings at once

str_detect() find strings
mydata <- tibble(name = c("J.M.","Ella","Jay"), state = c("New Mexico","New York","Oregon"))Filter based on string detection
mydata %>% filter(str_detect(name,"J"))# A tibble: 2 x 2 name state <chr> <chr> 1 J.M. New Mexico2 Jay OregonCreates a column of TRUE/FALSE if detected
mydata %>% mutate( new_state = str_detect(state,"New"))# A tibble: 3 x 3 name state new_state <chr> <chr> <lgl> 1 J.M. New Mexico TRUE 2 Ella New York TRUE 3 Jay Oregon FALSEstr_replace_all(), str_replace()
mydata %>% mutate(state_old = str_replace_all(state, "New", "Old"))# A tibble: 3 x 3 name state state_old <chr> <chr> <chr> 1 J.M. New Mexico Old Mexico2 Ella New York Old York 3 Jay Oregon Oregonmydata %>% mutate( name2 = str_replace(name, "l", "-"), # first instance name3 = str_replace_all(name, "l", "-"), # all instances name4 = str_replace_all(name, fixed("."), "")) # special characters with fixed()# A tibble: 3 x 5 name state name2 name3 name4 <chr> <chr> <chr> <chr> <chr>1 J.M. New Mexico J.M. J.M. JM 2 Ella New York E-la E--a Ella 3 Jay Oregon Jay Jay Jaystr_sub(): shorten strings
Based on position 1 (start = 1) to length of string (end = -1)
mydata %>% mutate( short_name = str_sub(name, start = 1, end = 2), # specify start to end short_name2 = str_sub(name, end = 2), # specify only end short_state = str_sub(state, end = -3) # negative endices, from end )# A tibble: 3 x 5 name state short_name short_name2 short_state <chr> <chr> <chr> <chr> <chr> 1 J.M. New Mexico J. J. New Mexi 2 Ella New York El El New Yo 3 Jay Oregon Ja Ja OregPaste strings together with glue()
paste()is the base R way of pasting strings (surprise, it's hard to use)glue()is most useful when pasting data columns together- column names or function operations go inside
{} - See the glue vignette
all_data %>% mutate(info = glue("Student {record} is {age} with BMI = {round(bmi,1)}")) %>% select(record, info) %>% head(5)# A tibble: 5 x 2 record info <dbl> <S3: glue> 1 931897 Student 931897 is 15 years old with BMI = 17.2 2 333862 Student 333862 is 17 years old with BMI = 20.2 3 36253 Student 36253 is 18 years old or older with BMI = NA4 1095530 Student 1095530 is 15 years old with BMI = 28 5 1303997 Student 1303997 is 14 years old with BMI = 24.5Using glue to summarize data
- Useful for tables (will cover this more in another session)
- Example, calculate the S.E. of the mean and create a column with "mean (SE)" of bmi:
demo_data %>% group_by(sex) %>% summarize(n_sex = n(), bmi_mean = mean(bmi,na.rm=TRUE), bmi_sd = sd(bmi,na.rm=TRUE)) %>% mutate(bmi_mean_se = glue("{round(bmi_mean,1)} ({signif(bmi_sd/sqrt(n_sex),2)})"))# A tibble: 3 x 5 sex n_sex bmi_mean bmi_sd bmi_mean_se <chr> <int> <dbl> <dbl> <S3: glue> 1 <NA> 231 NaN NaN NaN (NaN) 2 Female 9592 23.3 4.96 23.3 (0.051)3 Male 10177 23.7 5.01 23.7 (0.05)Wrangle dates with lubridate
- Convert characters to special "Date" type
- Convert terrible excel date formats into workable data
- Easy date magic examples:
- add and subtract dates
- convert to minutes/years/etc
- change timezones
- add 1 month to a date...
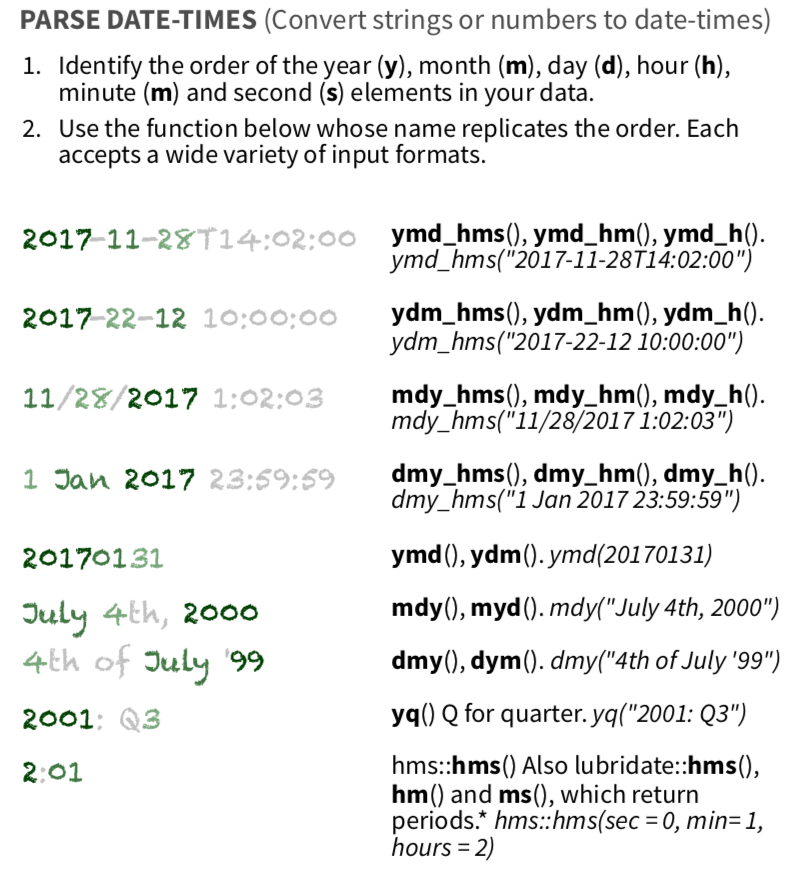
lubridatecheat sheetread_csvandread_exceletc automatically import dates correctly
What kind of date do you have?
timedata <- tibble(name = c("Yi","Bo","DJ"), dob=c("10/31/1952","1/12/1984","2/02/2002"))timedata %>% mutate(dob_date = mdy(dob), dob_wrong = dmy(dob)) # wrong order# A tibble: 3 x 4 name dob dob_date dob_wrong <chr> <chr> <date> <date> 1 Yi 10/31/1952 1952-10-31 NA 2 Bo 1/12/1984 1984-01-12 1984-12-013 DJ 2/02/2002 2002-02-02 2002-02-02Math with dates
timedata %>% mutate( dob = mdy(dob), # convert to a date dob_year = year(dob), # extract the year time_since_birth = dob %--% today(), # create an "interval" age = time_since_birth %/% years(1), # modulus on "years" dobplus = dob + days(10) # add 10 days )# A tibble: 3 x 6 name dob dob_year time_since_birth age dobplus <chr> <date> <dbl> <S4: Interval> <dbl> <date> 1 Yi 1952-10-31 1952 1952-10-31 UTC--2019-05-23 UTC 66 1952-11-102 Bo 1984-01-12 1984 1984-01-12 UTC--2019-05-23 UTC 35 1984-01-223 DJ 2002-02-02 2002 2002-02-02 UTC--2019-05-23 UTC 17 2002-02-12Factors - categorical data
- Clean and order factors with
forcatspackage - Will go over this for
ggplot2(visualization), statistical modeling (i.e. forlm()), and probably a workshop for creating tables - See
forcatscheatsheet andforcatsvignette
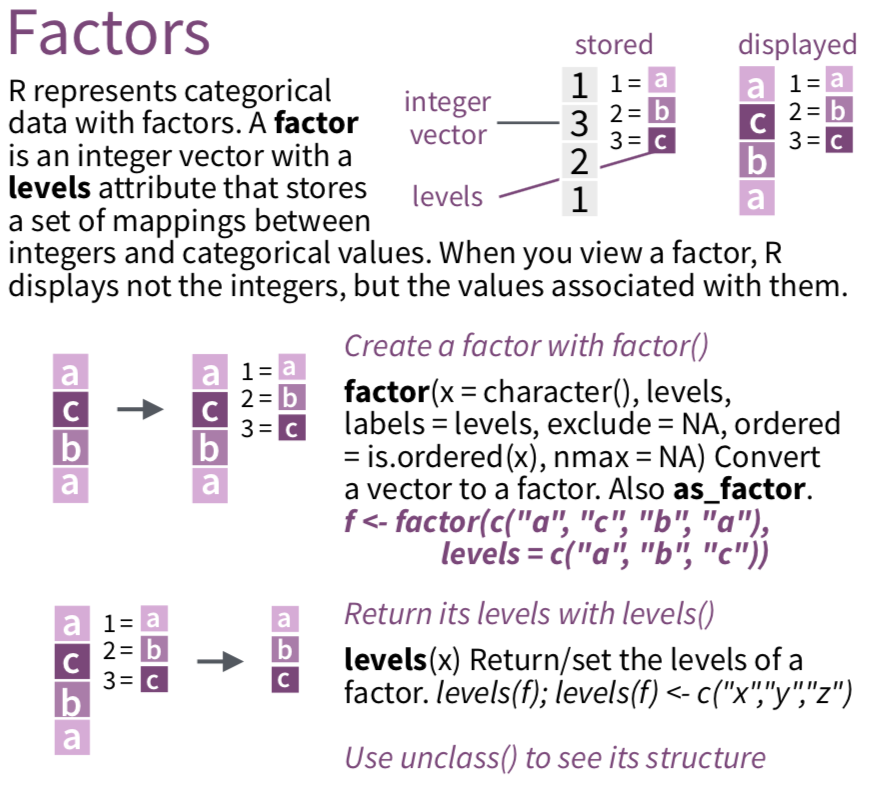
forcats examples - specify levels fct_relevel()
mydata <- tibble( id = 1:4, grade=c("9th","10th","11th","9th")) %>% mutate(grade_fac = factor(grade))levels(mydata$grade_fac)[1] "10th" "11th" "9th"mydata %>% arrange(grade_fac)# A tibble: 4 x 3 id grade grade_fac <int> <chr> <fct> 1 2 10th 10th 2 3 11th 11th 3 1 9th 9th 4 4 9th 9thmydata <- mydata %>% mutate( grade_fac = fct_relevel(grade_fac, c("9th","10th","11th")))levels(mydata$grade_fac)[1] "9th" "10th" "11th"mydata %>% arrange(grade_fac)# A tibble: 4 x 3 id grade grade_fac <int> <chr> <fct> 1 1 9th 9th 2 4 9th 9th 3 2 10th 10th 4 3 11th 11thforcats examples - collapse levels
mydata <- tibble(loc = c("SW","NW","NW","NE","SE","SE"))mydata %>% mutate( loc_fac = factor(loc), loc2 = fct_collapse(loc_fac, # collapse levels south = c("SW","SE"), north = c("NE","NW")), loc3 = fct_lump(loc_fac, n=2, other_level = "other") # most common 2 levels + other )# A tibble: 6 x 4 loc loc_fac loc2 loc3 <chr> <fct> <fct> <fct>1 SW SW south other2 NW NW north NW 3 NW NW north NW 4 NE NE north other5 SE SE south SE 6 SE SE south SEOther "janitor" work

Clean messy column names with clean_names()
mydata <- tibble("First Name"= c("Yi","DJ"), "last init" = c("C","R"), "% in" = c(0.1, 0.5), "ñ$$$"= 1:2, " "=3:2," hi"=c("a","b"), "null"=c(NA,NA))mydata# A tibble: 2 x 7 `First Name` `last init` `% in` `ñ$$$` ` ` ` hi` null <chr> <chr> <dbl> <int> <int> <chr> <lgl>1 Yi C 0.1 1 3 a NA 2 DJ R 0.5 2 2 b NAmydata %>% clean_names() %>% # in the janitor package remove_empty(c("rows","cols")) # also useful# A tibble: 2 x 6 first_name last_init percent_in n x hi <chr> <chr> <dbl> <int> <int> <chr>1 Yi C 0.1 1 3 a 2 DJ R 0.5 2 2 bClean names of your excel sheet

library(readxl)read_excel("data/messy_names.xlsx", .name_repair = janitor::make_clean_names)# A tibble: 20,000 x 9 record age grade_string race race_2 bmi_kg_m_2 weight_kg x x_2 <dbl> <chr> <chr> <chr> <chr> <dbl> <dbl> <chr> <chr> 1 931897 15 y… 10th White White 17.2 54.4 some… <NA> 2 333862 17 y… 12th White White 20.2 57.2 notes <NA> 3 36253 18 y… 11th Hisp… Hispa… NA NA I th… <NA> 4 1095530 15 y… 10th Blac… Black… 28.0 85.7 why WHY? 5 1303997 14 y… 9th All … Multi… 24.5 66.7 <NA> <NA> 6 261619 17 y… 9th All … <NA> NA NA <NA> <NA> 7 926649 16 y… 11th All … Asian 20.5 70.3 <NA> <NA> 8 1309082 17 y… 12th White White 19.3 59.0 <NA> <NA> 9 506337 18 y… 12th Hisp… Hispa… 33.1 123. <NA> <NA> 10 180494 14 y… 10th Blac… Black… NA NA <NA> <NA> # … with 19,990 more rowsPractice
Copy and paste the code below into R to create the dataset messy_data
messy_data <- tibble(NAME = c("J N","A C","D E"), `months follow up` = c("", 10, 11), `Date of visit` = c("July 31, 2003", "Nov 12, 2005", "Aug 3, 2007"))Clean column names with
clean_names().Replace missing ("") data in
months_follow_upwith NA.Convert
months_follow_upto a numeric variable.Convert
date_of_visitto a date.Create a column called
date_last_visitthat is the date of visit plus months of follow up.Remove rows (cases) with missing data in
months_follow_up.Remove the spaces in
name.
Resources - tidyverse & data wrangling
Links
Some of this is drawn from materials in online books/lessons:
- R for Data Science - by Garrett Grolemund & Hadley Wickham
- Modern Dive - An Introduction to Statistical and Data Sciences via R by Chester Ismay & Albert Kim
- A gRadual intRoduction to the tidyverse - Workshop for Cascadia R 2017 by Chester Ismay and Ted Laderas
- "Tidy Data" by Hadley Wickham
Possible future workshop topics:
- reproducible reports in R (probably next)
- R Markdown and knitr
- Create dynamic Word, html, pdf documents with code + output
- tables
- ggplot2 visualization
- advanced tidyverse: functions, purrr
- statistical modeling in R
Fill out feedback forms to suggest more or help us prioritize!
Contact info:
Jessica Minnier: minnier@ohsu.edu
Meike Niederhausen: niederha@ohsu.edu
This workshop info:
- Code for these slides on github: jminnier/berd_r_courses
- all the R code in an R script
- answers to practice problems can be found here: html

 be careful!!!